Application of Acrel-5000 Energy Consumption Monitoring System in Ossen International B Tower
Ankerui Wang Changxing
Jiangsu Ankerui Electric Appliance Manufacturing Co., Ltd., Jiangyin, Jiangsu 214405, China
Abstract: This article takes the application of the Acrel-5000 energy consumption monitoring system in the Olsen International B Tower project as a case. It is introduced that the Acrel-5000 energy consumption monitoring system can realize the system integration of field devices, the collection, transmission and storage of data, thus realizing The classification and sub-item energy consumption measurement of the building verified the function and practicality of the system.
Keywords: Energy Consumption Monitoring Acrel-5000 System Integration Office Buildings Olson International
1 Introduction
With the advancement of China’s urbanization process and the development of the economy, the total energy consumption in China’s buildings has continued to increase, and the growth rate has become faster and faster. At present, China is already the world’s second largest energy producer and consumer. According to statistics, China’s building energy consumption accounts for about 28% of the country’s total energy consumption. In China’s newly built 2 billion square meters of buildings, 99% of which are It is a high-energy-consuming building; only 4% of existing buildings have adopted energy-saving measures. If the building energy consumption is allowed to increase at this rate, it will inevitably bring great pressure on China's energy supply security. Therefore, building energy efficiency is imperative. This article through the analysis of the case of energy-conservation monitoring system of Euson International Group B, briefly introduces the application of Acrel-5000 energy consumption monitoring system in office building projects.
2 Design basis
"Guidelines for Energy-Saving Data Collection Techniques for Energy Consumption Monitoring System of Office Buildings and Large Public Buildings of State Organs"
"Technical Guidelines for Energy Consumption Data Transfer of Office Energy Consumption Monitoring System for Office Buildings and Large Public Buildings"
“Guidelines for the Design and Installation of the Measurement and Installation of Energy Consumption Monitoring System for Offices of State Organs and Large-scale Public Buildingsâ€
"Technical Guidelines for the Construction and Maintenance of Data Centers for Energy Monitoring Systems for Offices of State Organs and Large Public Buildings"
"Code for the construction, acceptance and operation management of energy monitoring systems for office buildings and large public buildings of state agencies"
"Design Standards for Energy Efficiency of Public Buildings" GB50189-2005
"Technical Specifications for Energy Saving Reconstruction of Public Buildings" (Industry Code) JGJ176-2009
"Green Design Specifications for Civil Buildings" JGJ/T229-2010
"Civil Building Energy Consumption Data Collection Standard" DL/T448-2000
"Civil Building Electrical Design Specification" JGJ16-2008
"Xi'an Public Building Energy Consumption Monitoring System Technical Specification" DBJ61/T97-2015
Other relevant national and local standards
3 Project Overview
Oson International Building B is located in Yanta District, Xi'an City, Shaanxi Province, east of No. 22 Road and south of Science and Technology Fifth Road. The total construction area is approximately 45,992.28 m2, and the building height is 94.6 meters. There are 22 floors underground and 2 floors above ground.
There is a power distribution room in this project. It is located on the basement floor and has a total of 106 inlet and outlet loops. There are 60 inlet and outlet loops in addition to the capacitor cabinet and backup outlet circuit. The 60 Sfier multifunctional power meters installed on the power distribution cabinet use the RS-485 bus network to access the energy analysis management system. The system host is installed in the first floor of the fire control control room.
Shanghai Ankerui Electric Co., Ltd. undertook the design and implementation of Ausen International's B-Block energy monitoring system in 2017. The system adopts the Acrel-5000 energy monitoring system, which mainly realizes on-line monitoring of the power consumption of the building and facilitates the energy management of the building.
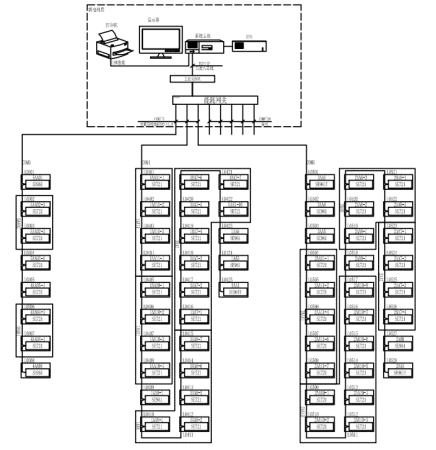
4 System Architecture
Acrel-5000 building energy consumption analysis management system is based on the workstation host, communication equipment, measurement and control unit as the basic tool, providing a basic platform for the acquisition of the real-time data of Block B of OSENS International B, which can constitute an arbitrarily complex monitoring system. The system mainly adopts a hierarchical distributed computer network structure and a total of 60 power meters on site, as shown in the system structure diagram:
5 System Software Module
â— Comprehensive energy consumption main interface
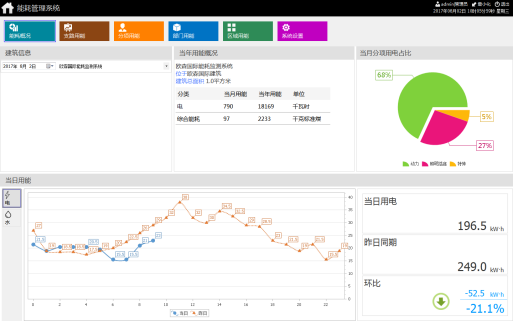
The comprehensive energy consumption reflecting the energy consumption of each category of the building in the year and conversion to standard coal is shown. The energy use-by-hour energy curve of the current day is displayed below the interface.
â— Classified energy consumption main interface

Reflect the energy consumption (for example, electricity) in a certain category and the same period in yesterday, the same period in the previous month, the energy consumption in the same period in the previous month, the same period in the previous month, the same period in the previous year, and the growth percentage and increase;
Reflect energy consumption trends of the past 48 hours, the past 31 days, the past 12 months, and the past 3 years of a certain classification energy consumption;
Classification Energy Consumption Branch Energy Usage Statistics Report

It can flexibly select the branch road and count the daily, monthly, weekly, seasonal and annual energy use of the branch energy during a certain period of time;
With the powerful function of the following table, users can perform various data statistics and sort the data in combination;
Statistical data can be displayed by various charts such as histograms, dotted charts, stacked charts, and pie charts;
Statistics can be exported to Excel;
Itemized energy consumption profile
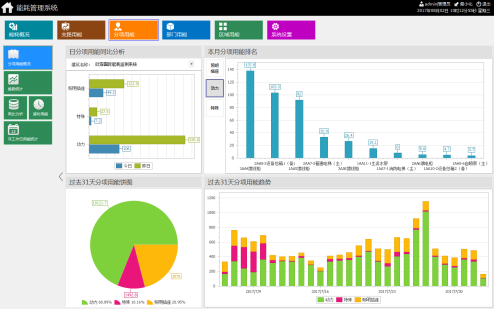
According to the sub-item for energy statistics and display. The daily energy consumption analysis shows the energy consumption histograms of different items on the same day and yesterday (blue bars show today, green bars show yesterday); the energy pie chart shows the energy consumption of each item in the past 31 days; The stacked chart shows the energy consumption trend of each item in the past 31 days; the breakdown by energy ranking shows the top 10 branches of the selected item corresponding to the energy consumption value.
Statistics can be exported to Excel;
Energy use by item
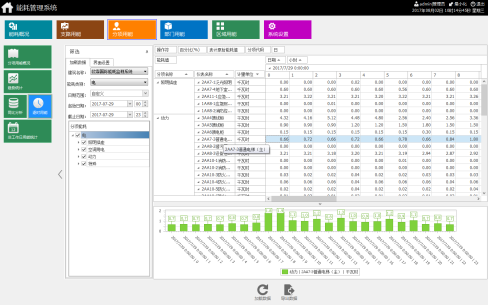
Statistics will be used day by day, week by week, month by month, quarter by year, year by year for each sub-item. Select the branch to be queried, 'Load data' to view the energy trend of each branch in the sub-item, and query according to the existing date or custom time. The branches here are based on the configuration of the classification items in the basic data. The default query is the energy consumption of the current month.
Statistics can be exported to Excel;
Parameter query
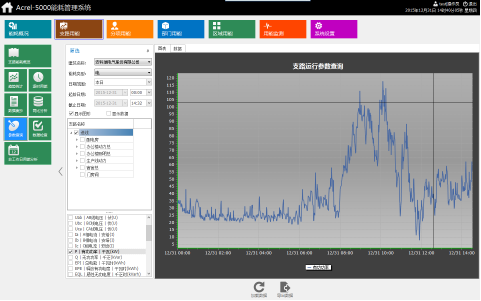
Query the parameters of each loop branch for a certain period of time, and reflect the trend in the form of curves (the specific parameters that can be queried are related to the installed instrument, and cannot cross the month during the query, and the interval is one minute when drawing the curve). The power parameters can be Multiple choices.
Configuration options
According to the relevant technical specifications, the basic information of the building is configured, such as: building function, building area, air conditioning area, building address, etc., in which the building area and other information will be used to analyze energy consumption per unit area;
Configure the basic information such as the type, model, and manufacturer of the instrument used in the project, and add the monitoring parameter information that can be provided by this type of instrument. The configuration affects the energy consumption statistics, statistics of energy consumption over time, and parameter query functions.
All metering instruments used in the configuration project, save metering instrument address, transformation ratio, corresponding collector, code, monitoring circuit name and other information;
The information related to metering, proportioning, and calculation methods involved in configuring itemized energy consumption statistics can be flexibly configured according to the situation of the project. The configuration information here will affect the energy consumption analysis of each classification. ;
Configure the measuring instruments, computing methods, proportions, and department energy plans for each department's energy use. After completing this configuration, the department's energy consumption analysis module will be enabled.
Configure the meter, calculation method, and proportion of an energy use area in the building. After completing this configuration, the regional energy consumption analysis module will be enabled.
Hardware selection
Station control management uses an industrial computer and an online UPS power supply. Communication layer equipment uses an 8-port energy gateway.
Field device layer: It is a data collection terminal, mainly composed of smart meters. The power meter is connected to the communication server through a shielded twisted pair RS485 interface, using a MODBUS communication protocol bus type connection, and the communication server and switch arrive at the monitoring host, and the field instrument passes the double. The twisted wires are connected in a hand-in-hand manner and the number of meters per bus is less than 25.
The monitoring point of this project is located in the transformation and distribution room of Block B of Olsen International. The 60 power meters in the power distribution room are divided into three buses and are respectively connected to the energy consumption gateways in the data collection box.
7 Software Design Ideas
The principles to be followed in the software design of the energy consumption monitoring system are: system security, system availability, real-time performance of the system, system stability, system scalability, and easy maintenance of the system.
8 Outlook
According to the analysis of the effect of the Ausen International energy consumption operation, a typical energy consumption analysis model was established and analyzed.
â— Establish a building energy consumption measurement system, focus on the building energy consumption, find the energy consumption shady, and make energy-saving changes more targeted. At the same time, we will consolidate the achievements of energy-saving reform through management measures such as measurement fees and performance assessment.
â— Select energy-saving equipment.
â— Even the best energy-saving equipment can't control waste and can't exert energy-saving effects. By increasing automation energy-saving equipment, formulating equipment operation strategies, reducing human intervention, and centralizing management and control, energy-saving equipment is achieving energy conservation.
Through the same-ring analysis data provided by the energy consumption monitoring system, the results of energy-saving transformation are quantified and the energy-saving effect is maximized.
9 Conclusion
With increasing energy shortages, energy saving and consumption reduction have become an inevitable choice for the intelligent construction of large-scale buildings. The Acrel-5000 energy consumption monitoring system introduced in this paper can monitor the operating status of energy-consuming equipment and draw out each of them based on the collected data. The reports, analysis curves, and graphs are convenient for analysis and research and provide reference for energy-saving technologies in intelligent buildings. The system is safe and reliable, which greatly facilitates the use of the user. With the development of society and the growing shortage of energy resources, remote monitoring and management of classified energy consumption and itemized energy consumption have become an inevitable trend in the development of intelligent buildings.
references
Ren Chengcheng and Zhou Zhong compiled the principle and application guide for power metering digital instrument. China Electric Power Press 2007.4
Zhu Liquan Intelligent Management System Analysis of Power Distribution System Intelligent Building Electrical Technology Vol. 1 No. 4 2007
Tonemy Aroma produces and exports battery powered aroma diffuser, battery aroma dispenser for small area, Wall Mounted Scent Diffuser with battery powered, used for corridor, elevator, room, washroom, toilet...time setting diffuser machine.
Battery Powered Aroma Dispenser,Mini Essential Oil Diffuser,Portable Oil Diffuser,Aroma Dispenser
Guangzhou Tang Mei Environmental Protection Technology Co.,Ltd , https://www.diffusermachine.com